
me&u and Next Phase: Beyond the Counter Live
Simon Anderson of Next Phase, along with some of the panelists from the day
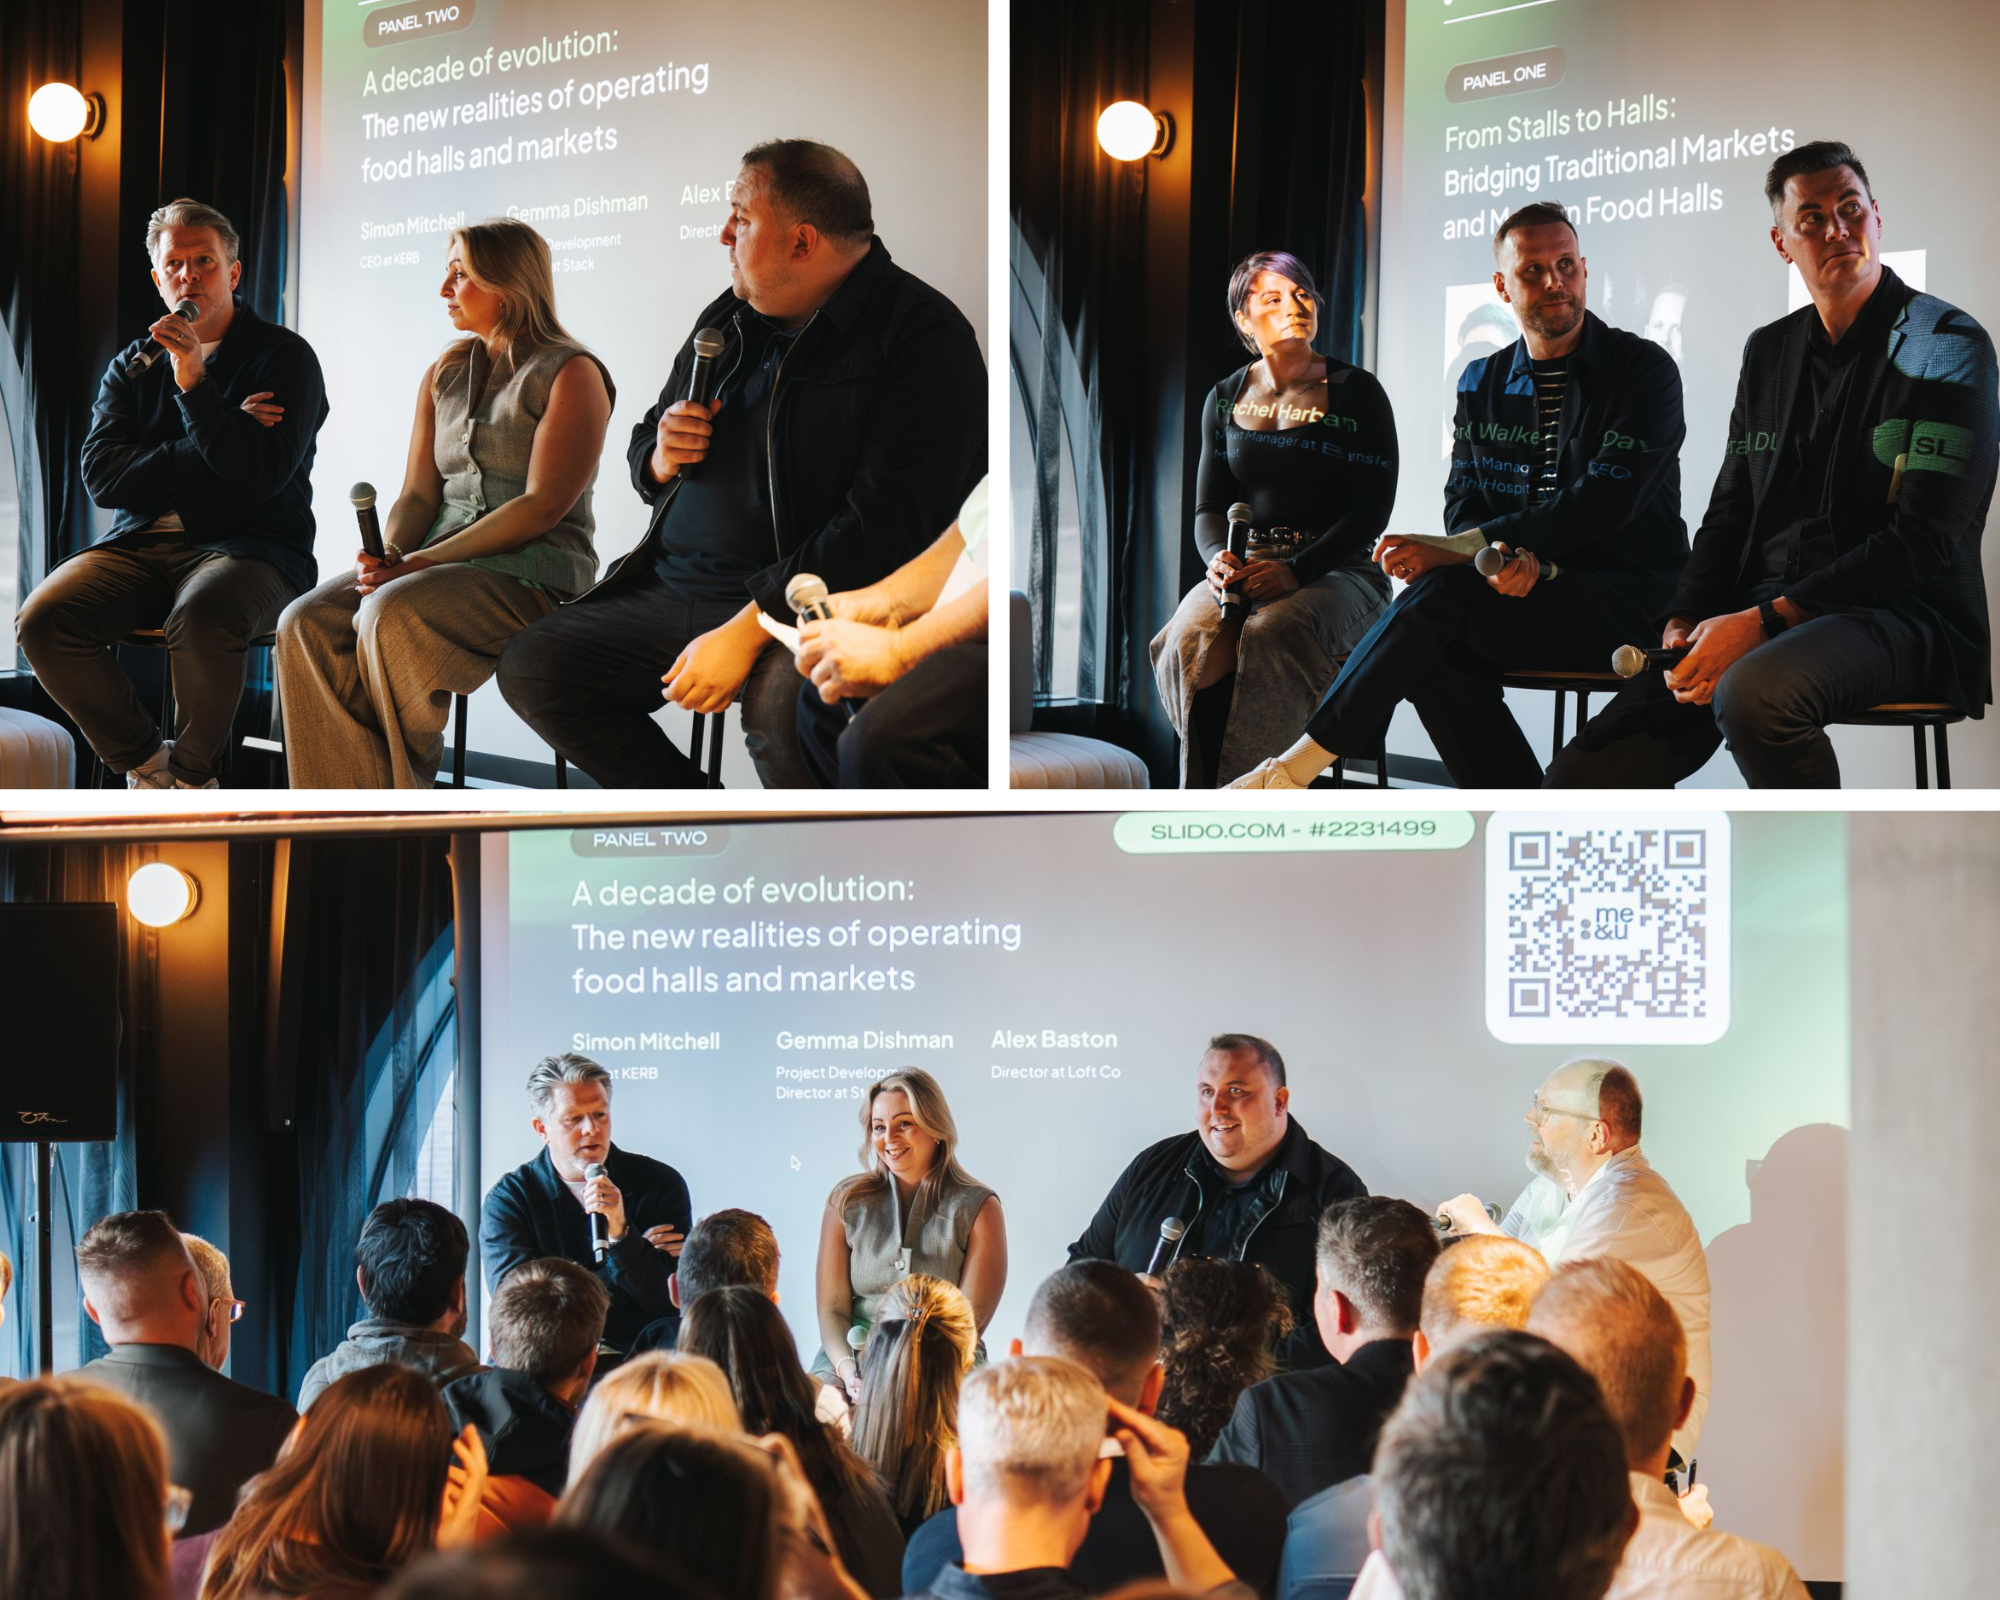
Beyond the Counter Live at House of Social in Manchester was a huge success, and it proved again that the me&u and Next Phase partnership is setting the pace on insight for food halls and markets. We brought together an operator only room, two sharp panels, and the right level of honesty about what it takes to run these venues in 2026. Panel one looked at a decade of change with Simon Mitchell (KERB), Gemma Dishman (STACK) and Alex Baston (Loft Co.). Panel two went deep on markets with Rachel Harban (Barnsley Market), Richard Walker (The Hospitality Collective) and David Catterall (NABMA).
A big part of the day was the first look at the Multi Vendor Operator Annual Report 2026, produced with me&u using real ordering data, an anonymous operator survey, and Next Phase research. The headline is simple, the market is still moving fast. Our mapping shows 149 trading food halls in March 2026, up from 114 in March 2025, and 65 more in development, up from 52. Our review of the Top 50 also gives a useful reality check on what “normal” now looks like: around 14,000 sq ft, roughly 350 covers, about 9 kitchens and 2 bars. It is a helpful benchmark when people start designing something that looks great on paper but will be painful to operate.
A few more data points stood out. Nearly half of operators now run a hybrid service model, drinks to table with food collection (48%), while 32% are fully delivered and 20% are fully collection. On marketing and CRM, 44% use email, 36% use both email and SMS, and 20% use neither, which shows there is still serious headroom in basic data capture and re marketing. Commercially, major city venues average £5.6m annual revenue versus £1.8m outside the major cities. Demand is also heavily concentrated: 17:00 to 20:00 drives around 48% of major city revenue and 41% in non major locations, and Saturday alone accounts for 31% to 36% of weekly sales depending on location. On cuisine performance, crowd pleasers still win, burgers (+58%), fried chicken (+54%) and BBQ (+46%) perform well above average, while dessert, cafe coffee and sandwiches underperform most.
We co produced the report with me&u to blend ordering data, operator input, and our market mapping. It covers market size and pipeline, cuisines, financial performance, guest behaviour, guest feedback, and operator trends.